The psychological opportunities and costs of generative AI in Higher Education: A guide to generating informative content

Why I wrote this blog
I’ve been concerned that universities are spending time grappling with questions over the legitimacy and credibility of generative AI tools whereas individual academics do not always consider the tools through a disciplinary lens. I’ve tentatively approached the opportunities and challenges presented by generative AI, seeing what is available as a set of tools that we shouldn’t try to punish away, nor embrace uncritically.
How I wrote this blog
This post was produced with assistance from Perplexity using the prompt: ‘please give me up to 10 points that are suitable for an infographic on the challenges and incentives to adoption of generative AI in higher education, from an applied psychology perspective’. And yes, my family does laugh at me when I say ‘please’ to AI assistants but it’s been the ‘magic word’ all my life.
You can see the original answer from Perplexity. If you follow the link, you’ll also see that Perplexity cites its sources, which I like. However, you can’t select sources to exclude. Also like most other generative AI tools, you can refine your prompts and thus its output, I didn’t do that here as I liked what it generated and I narrowly, side-stepped the temptation to follow it down a rabbit hole (or entire warren).
After the original prompt, it presented a set of potential follow-ups. Some focus on ethics and data privacy; others, on personalised learning. These feel timely and relevant. It also provided several infographics that already exist, and I looked to see if they would do the job. However, they weren’t evaluating the potential risks and benefits and there was nothing from a psychological perspective.
This post’s image was generated in Ideogram using this ‘magic prompt’: A 3D render of a hyper-realistic silhouette of two students in graduation caps and gowns, made out of data. The data is represented as lines and points, creating the shapes of the students and their outfits. The background is a dark void.
Generating an infographic
I toyed with an auto generated infographic, from Piktochart. It was straightforward to use:
- edit the output from Perplexity
- upload a word file with the edited prompts
- pick a template
- check how Piktochart used the prompts for content
- edit the images
- you have something shareable.
However, you have to pay if you want to download it. Monthly fees are beyond the non-existent Applied Psychology Research Group (APRG) budget so embedded later in this post, you can also see an infographic produced with AI assistance, without being AI-generated. The two versions also illustrate different styles of infographic.
Using Canva to create an infographic
In the APRG, most colleagues use Canva. Avoiding using a template I’d recently used for another project, I settled on an infographic based on the “Black Doodle Tools for Generating Ideas” template by Cristina Culubret. I adjusted the colours to create a teal and black textured background, using the automatic tools in Canva and stuck with the original images as they relate to computing and creativity.
Having checked the Perplexity output against my understanding of the theories cited, I considered adding in other academic sources. If creating a slide stack for a lecture, I’d have done that. For a journal submission, I would have thought about ways to conduct an efficient, systematic literature search. For this post, I wanted to explore relatively straightforward possibilities and I was already worried about cluttering the output. So, what you see in the two versions is based on “face validity” or a check of intuitive appeal. It’s the Perplexity output edited against my understanding of the literature/theories and some text tweaking to sound more like me. The point I developed most related to ethics and I reordered to my taste.
Here is the complete list of the text that I started with, before editing it down again. It’s presented here in case you prefer reading it that way, but also by way of Alt Text for the content in the infographic that follows.
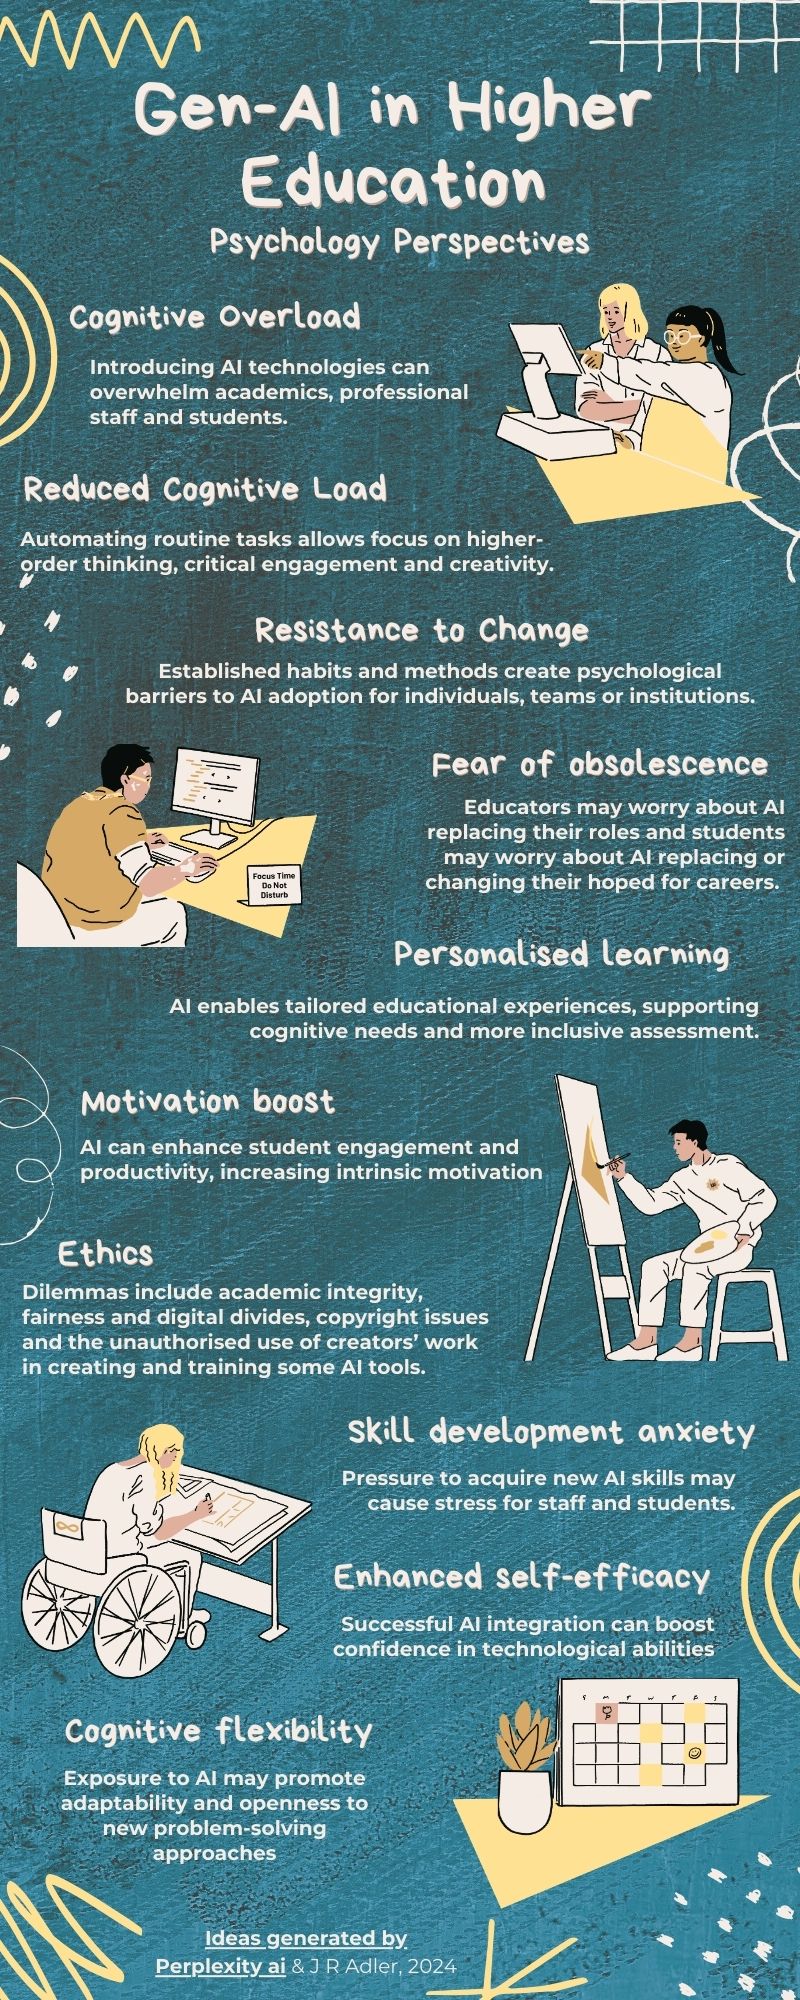
There are 10 sections to the "infographics":
- Cognitive overload: Introducing AI technologies can overwhelm academics, professional staff and students. This can lead to additional worries, apathy and/or resistance
- Reduced cognitive load: Automating routine tasks allows focus on higher-order thinking, critical engagement and creativity
- Resistance to change: Established habits and traditional methods create psychological barriers to AI adoption. This could be at an individual, team or institutional level
- Fear of obsolescence: Educators may worry about AI replacing their roles and students may worry about AI replacing or changing their hoped for careers. In either case, this uncertainty may be related to anxiety and reluctance to engage with tools
- Personalized learning: AI enables tailored educational experiences, addressing individual cognitive needs and potentially helping with more inclusive assessment
- Motivation boost: AI can enhance student engagement and productivity, increasing intrinsic motivation
- Ethical concerns: Worries about academic integrity, fairness and digital divides may create additional moral dilemmas for adopters. Some people worry too about copyright issues, whether information should be in the public domain and the fairness of how the AI tools were themselves created
- Skill development anxiety: Pressure to acquire new AI-related skills may cause stress for staff and students
- Enhanced self-efficacy: Successful AI integration can boost confidence in technological abilities
- Cognitive flexibility: Exposure to AI may promote adaptability and openness to new problem-solving approaches.
Time to create what you see in this post: 60 minutes. Time faffing around rejecting different potential software and looking at alternative templates: three times as long, I’m considering it part of my CPD!
Authors
APRG lead and Professor of Forensic Psychology, Joanna R Adler
Image produced on Ideogram AI
Infographics produced on Canva and Piktochart