Stars, star clusters, and superbubbles
(Krause)
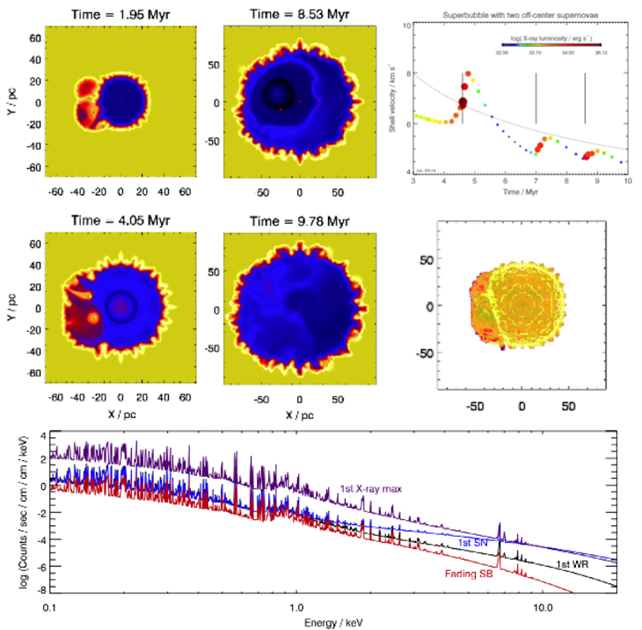
Massive stars impact their surroundings via their radiation and winds and often explode at the end of their lives as supernovas. Since massive stars rarely occur in isolation, the bubbles blown by these winds and explosions often overlap forming a superbubble. The interstellar medium in star-forming galaxies is usually dominated by volume by these superbubbles. We have studied the evolution of superbubbles with 3D hydrodynamic simulations and were able to explain a number of observed properties by the distinct evolution of 3D instabilities. This includes sizes and energetics, the short X-ray-bright episodes with soft spectra and associated shell acceleration.

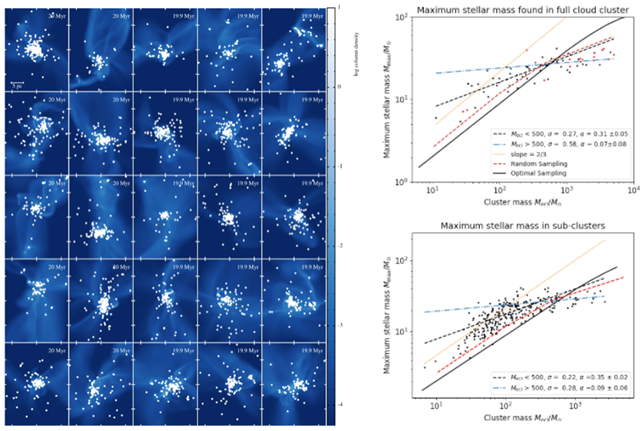
We have also studied various aspects of the formation of star clusters. Varying the exact initial conditions within a given statistical setup, we found a 60% variation in star formation efficiency for clouds of a given mass. The mass of the most-massive star formed also varies statistically as well as systematically as a function of cloud and star cluster mass.
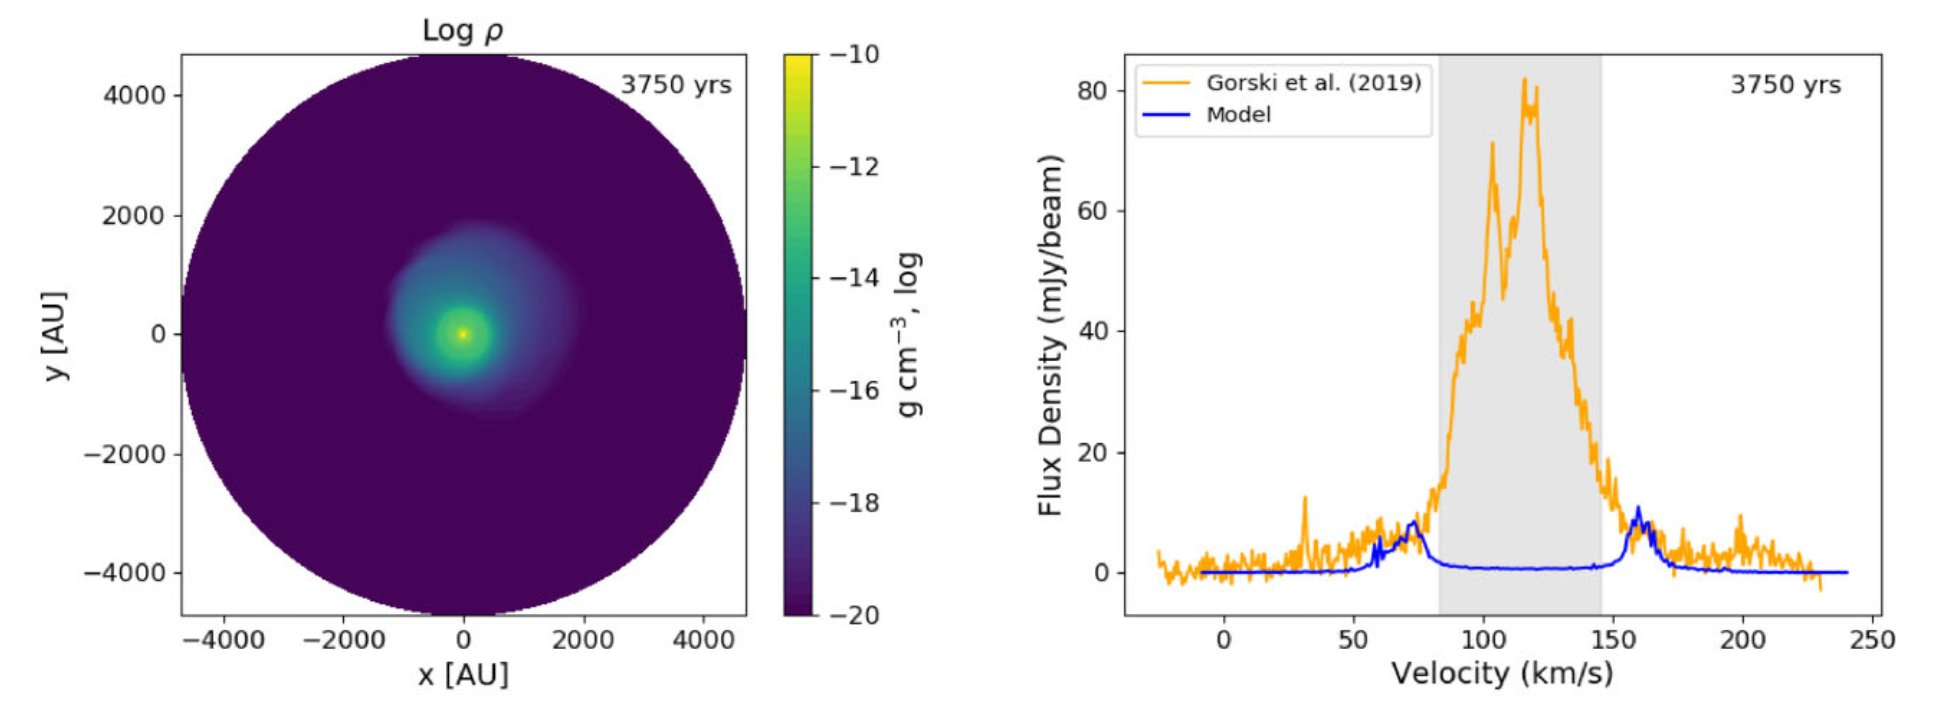
The most massive star clusters are the globular clusters. They show strong signatures of early self-enrichment, where the ashes from nuclear burning in the centres of massive stars are ejected in winds still during the formation episode of the cluster. One scenario requires stars of exceptional mass > 1000 Msun, so called supermassive stars. Such stars are so far purely hypothetical. It is therefore important to establish new ways of identifying observational evidence for such stars. To this end, we have modelled the strong, so far unexplained H2O maser line at 22 GHz from a young massive cluster as emission in an edge-on accretion disc around a supermassive star. We require the star to have approximately 4000 times the mass of the sun to explain the maser data.

