
Does parental awareness of gaps in knowledge of a limited number of mathematics skills lead to greater improvement in students' understanding?
Jeanette Denton and Brenton Legarda - Chancellor’s School, Hatfield, Hertfordshire

Abstract
The Government’s introduction of Assessment Without Levels (DfE, 2015) provided an opportunity to review the Scheme of Work and assessment procedures for Year 7 students at Chancellor’s School. As part of the Herts and Bucks Teaching Schools Alliance and the University of Hertfordshire’s Enquiry+ initiative, we designed and implemented a new scheme of work, a new style of assessment, and a new method of communicating students’ results with parents. We did this to explore: whether increasing parental awareness aids the progress of Year 7 students; whether reducing assessable elements and targets has an impact on the progress students make; and finally, if removing levels on formative assessment reduces students’ test anxiety. To help answer these questions, we introduced innovative changes to mathematics teaching with the 2015 intake of students and used pre- and post-unit assessment of Year 7 students. With selected (experimental) groups within this Year parents were informed about the targets their son or daughter had received, and were directed to the independent learning resources that their son or daughter were shown in lessons. The teachers of Year 7 students used the pre-unit test to tailor their teaching to the needs of the class. The teachers of each of the six classes also gave two targets to each student to work on during the unit which were supported by independent learning resources published on Show My Homework, an online tool for viewing and setting homework. In addition to this, parents of students in the experimental groups received a letter stating the two targets that were given, as well as how they could access the independent learning resources. The progress made between the pre-unit and post-unit assessments shows that the students in the experimental group made statistically significantly higher levels of progress than those in the control groups. Furthermore, the 2015-2016 cohort of students made significantly more progress than the 2014-2015 cohort of students in the first school term. The changes made to the Scheme of Work and assessment procedures continue within Year 7 have been extended to Year 8 as a result of these findings.
Introduction
The Government introduction of Assessment Without Levels (DfE, 2015) provided an opportunity to review the Scheme of Work and assessment procedures for Year 7. The then Minister of State for Schools, Nick Gibb (2015) outlined the advantages of the approaches used by ‘Wroxham Primary School in Potter’s Bar - with a demanding, mixed intake - doesn’t and hasn’t used levels as it has made its journey from ‘special measures’ to repeated judgments of ‘outstanding’. This opportunity was not taken lightly. In fact, we embedded the use of the progress sheets shown by a teacher from the Wroxham School to create an easily adaptable scheme of work that allowed teachers to record and show how students were making progress.
While working with the National Curriculum it seemed clear to the authors that teachers were being asked to report on far too many topics and, consequently, departments devised the only manageable way to assess, nothing more than a mark on a test. Students needed some control over their learning and to do this they needed to be aware of the specific skills that they are to be assessed on, thus giving students a real chance of developing into independent learners. In order to allow this to happen at Chancellor’s School the 100 (or more) topics from the National Curriculum were reduced to 22 fundamental concepts. The selection of which concepts were included in the 22 fundamental concepts was based on our professional judgement. These topics were classified into eight themed headings. No less mathematics has been done over the year, but there has been a greater emphasis on depth and application.
Although the changes to the scheme of work and assessment were largely based on our professional experiences and judgments, further inspiration was drawn from educational authors such as Jo Boaler (2015), Carol Dweck (2006) and David Williams (2011). There were two aspects to the research. The first concerned a whole year group. We introduced innovative changes to mathematics teaching with the 2015 intake of students and used pre- and post-unit assessment of Year 7 students. Using pre- and post-unit tests with nearly identical questions would give the students an opportunity to see their progress more clearly (Williams, 2011). Providing each student with two targets at the end of the pre unit test, specific to their needs, and supplying independent learning resources promoted the idea that success was achievable for all students (Dweck, 2006). A large part of the scheme of work was dedicated to investigation and project work to allow students to explore mathematical concepts, providing them with the opportunity to develop a deeper understanding of key ideas (Boaler, 2015). The second aspect concerned the enhancement of parental awareness. With selected (experimental) groups within this year group, parents were informed about the targets their son or daughter had received, and were directed to the independent learning resources that their son or daughter were shown in lessons.
Context
Chancellor’s School is a comprehensive school of approximately 1000 students, including Sixth Form. The research project was based upon a new scheme of work designed to improve the quality of teaching and learning of Year 7 Mathematics Students. Specifically, the department felt that the previous scheme of work was not flexible enough to provide support or challenge where necessary. Furthermore, it did not provide enough opportunities for students to spend time exploring mathematics through projects or investigations. The scheme of work was also designed with new assessment to allow assessing and reporting without National Curriculum Levels.
When students arrived at Chancellor’s School they were given baseline tests for all core subjects, the results of which, along with Key Stage Two data, were used to place students into sets. There were two parallel groups of three sets. The top and bottom sets (sets one and three respectively) were used as control groups (four control groups), while the middle sets were the experimental groups (two experimental groups). Although the research on the effect of ability grouping in secondary schools is mixed (Slavin, 1990), there is a general consensus among mathematics teachers that top set students make more progress throughout a key stage, compared to students in the bottom set. Some may feel that this research can only be related to middle sets, but the Key Stage 2 SATS levels ranged from 4c to 5a. This range could represent expected progress across an entire Key Stage. Great efforts were made to ensure that this project was run ethically, and that all students had access to the same resources. The only difference between the control and experimental groups was that the parents of the experimental groups were informed about the targets their son or daughter had received, and were directed to the independent learning resources that their son or daughter were shown in lessons.
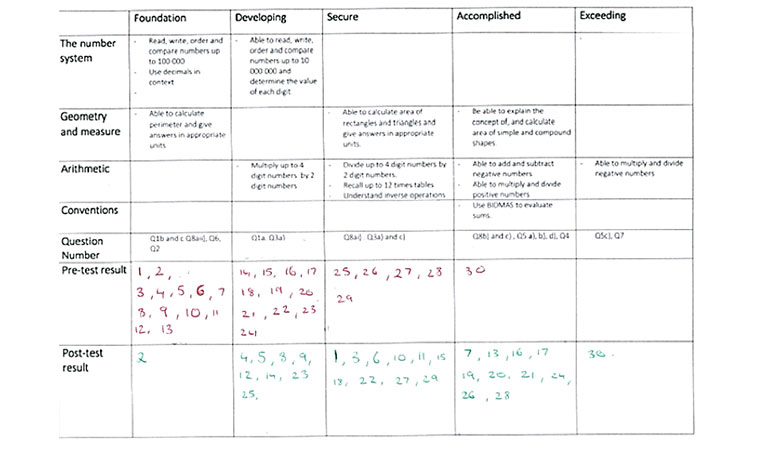
In the creation of a new way to record and monitor progress, the Mathematics Department took inspiration from Wroxham School. Wroxham School is a feeder primary school for Chancellor’s school. Over the last decade it has made the transition from a school judged by OFSTED as “Inadequate” and placed in special measures (2003), to a school judged as “Outstanding”, first in 2009 and in every inspection since. On a joint INSET day, a teacher from Wroxham shared a recording grid which she used to track the progress of individual students. This initial grid was then adapted to our scheme of work and used in pre- and post- unit tests (See Figure 1).
Figure 1 - Tracking sheet to show progress between pre-unit test and post-unit test. Students’ initials are replaced by numbers for anonymity.
Methods
Pre-test and Post-testing
The pre-test for all three units in this research was completed under test conditions. These units were chosen as they were the first three units completed once the students had been placed into their sets. The pre-test was used to establish a baseline for the students and to inform teachers’ planning. Once the pre-test had been marked by their teacher each student received individual feedback in the form of two targets to focus on throughout the unit. Students had some say in selecting these targets. The marking of tests, and recording of the student’s initial position on the progress grid was heavily moderated during this research project. All students were then directed to independent learning resources which were accessible on Show my Homework. For both the experimental and control groups, parents had access to these resources on Show my Homework as well.
For two of these units a letter was sent home after the pre-unit test to two out of the six classes to inform parents of their son/daughter’s targets and the location of the independent learning resources. In order to eliminate the variable of teaching style and teaching experience the third unit was designated as a control unit. In this control unit, no letter was sent home to the experimental group. There was no specific reason why unit three was selected as a control. At the end of each unit a post-unit test was completed under test conditions. This provided information about student progress to teachers and gave students the opportunity to see how they have progressed in the unit. The data was analysed using a chi-square test. A chi-square test compares the ‘observed’ values for each variable with the ‘expected’ value. If the test statistic is greater than the critical value there is a significant difference between the two variables (Diamond and Jeffries 2001).
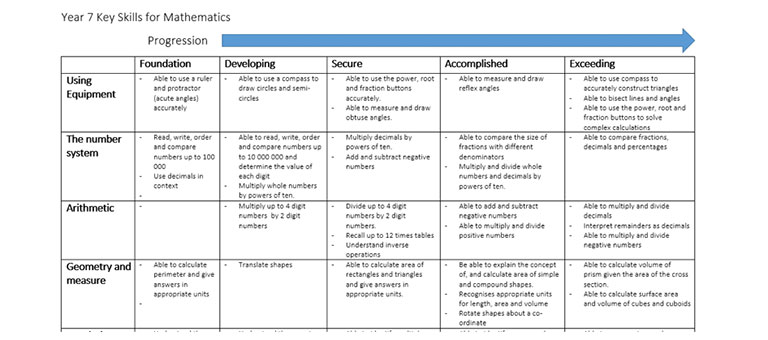
Progress was measured using the new threshold system introduced across the whole school. The Mathematics Department decided on which topics fitted in to each threshold, an overview of which can be found in Figure 2. Students demonstrate progression by moving from a mastery of skills on the left hand side of the table, to the right hand side of the table. Over the course of the year, students will have had an opportunity to master all of the skills. If a student had moved from a foundation level of understanding, to a developing level, their progression would be recorded as 1. The number of ≤0’s, 1’s, ≥2 levels of progress were used to compare the experimental and control groups.
Figure 2 - Criteria to show progress from the lowest level of understanding to the highest level of understanding for each group of key skills
Student Survey
The student survey was intended to gain insight into students’ experience of the intervention across the whole Year. It was noted by the Year 7 Teachers, through behaviour observations, discussions with individual students and discussions with parents, that there was a reduced anxiety around assessment. In order to quantify this, a survey of 100 randomly selected pupils (56 control, 44 experimental) was conducted. The survey took place after completing the three units of work analysed in this project. The survey aimed to determine the following:
- Levels of anxiety around pre- and post- testing
- Whether targets students received helped them improve their understanding
- Whether it was clear to students that they had or had not made progress in a unit of work
- The proportion of students who received help from their parents on their classwork and/or homework
- The proportion of students who accessed the independent learning resources
- How engaging students found the investigations and project work.
In most questions, students were asked to indicate their answer on a five point scale. Where students were asked about levels of engagement they were provide with an open-response format.
2014 vs 2015 Intake Data
To determine whether the changes to teaching, learning and assessment had an impact on student progress across the whole year group (i.e. control and experimental groups), the current cohort and previous cohort of students were compared using a chi-square test. We initially used a chi-squared test to compare the Key Stage Two data, which showed no significant difference between the two years. The autumn term progress data was then subject to the same statistical testing. There were some difficulties in comparing the old National Curriculum Levels to the schools’ new threshold system, but the conversions used were based on Senior Leaders’ recommendations.
Key findings
In order to determine whether the changes to the scheme of work, namely, removing levels from formative assessment, embedding investigations, and focusing on fewer assessable elements, improved student progress we compared the autumn progress of the 2014 cohort, with the control groups of the 2015 cohort (see Table 2). We also compared the Key Stage 2 Data to determine whether there was a difference in the intake between the two year groups (see Table 1).
Comparison of 2014 and 2015 Key Stage 2 Data
Level of Entry | 2014 | 2015 | Totals |
|---|---|---|---|
2b | 1 | 1 | 2 |
2a | 1 | 0 | 1 |
3c | 0 | 2 | 2 |
3b | 0 | 1 | 1 |
3a | 10 | 7 | 17 |
4c | 12 | 13 | 25 |
4b | 18 | 26 | 44 |
4a | 40 | 40 | 80 |
5c | 27 | 37 | 64 |
5b | 34 | 22 | 56 |
5a | 12 | 9 | 21 |
6c | 0 | 0 | 0 |
6b | 16 | 19 | 35 |
Totals | 170 | 176 | 346 |
We observed no statistically significant difference between the intake SAT levels of 2014 and 2015.
Autumn Progress data of 2014 vs 2015 (Control Group Only)
Progress sub levels | 2014 | 2015 | Total |
|---|---|---|---|
< and = -2 | 5 | 18 | 23 |
-1 | 19 | 20 | 39 |
0 | 35 | 30 | 65 |
1 | 50 | 24 | 74 |
2 | 31 | 20 | 51 |
3 | 24 | 6 | 30 |
4 | 4 | 7 | 11 |
5 | 0 | 0 | 0 |
6 | 2 | 1 | 3 |
7+ | 1 | 8 | 9 |
Total | 171 | 134 | 305 |
We observed a statistically significant difference between the data of 2014 vs 2015 and levels of progress made in the autumn assessment: χ2 (df 9, n=305) = 32.6, p<.05. Although the 2015 excludes the middle set, we believe that the results from the 2015 cohort would be even stronger if the experimental groups were included. This assertion is based on the data in tables 3 to 8, which show that the experimental groups made significantly more progress throughout the units where a letter was sent home, and progress in line with the other sets when no letter was sent home.
The responses to the student survey suggested that students find the smaller more frequent assessments less stressful than larger end of term assessments, with mean weighted scores of 3.31 and 2.81 respectively (where 1 represented most stressful and 5 represented least stressful). Additionally, 82% (n=82) of students said that it was clear which topics they would be assessed on in the post-test and 87% (n=87) of students responded to say it was clear whether or not they had made progress in a unit.
There did seem to be a number of comments that suggested students were counting the number of ticks they received on each test and using this as a method of measuring their progress, while others were paying more attention to their targets or specific questions they answered correctly. It is likely that the students were using ticks to measure progress as this is the habit they have developed in Key Stage Two. Furthermore, a surprising number (n=45) of students said that they would have liked to receive a grade or level with their paper. These comments suggest that the culture created by giving levels needs to be addressed and students need to be offered further training on how to judge their own progress using pre and post unit tests.
With respect to accessing help outside of lessons, most students relied on help from their parents (54%, n=54), closely followed by the independent learning resources (42%, n=42) published on Show My Homework. Interestingly MyMaths, an interactive online mathematics resource, was only accessed by 19% (n=19) of the students surveyed and only 8% (n=8) said they asked a teacher for help at break or lunchtime. Given that greater progress was made by the students in the experimental groups, it is likely that a higher proportion of students in these groups accessed the independent learning resources and received help from their parents, compared to the control groups. An analysis of all the survey questions is restricted due to the limitations on the size of this report.
The student progress was analysed on three units of work, numbered units 2, 3 and 4 respectively in the school’s scheme of work. On the two units where letters were sent home, students in the experimental group showed greater progress which was statistically significant at p<.05 (see Tables 3, 4, 5 and 6). One unit was kept as a control to remove any effect of teachers. The progress between the experimental and control groups was not statistically significant in this unit (see Tables 7 and 8).
Unit 2 where letter was sent home
Levels of Progress | 0 or less | 1 | 2 or more | Total |
|---|---|---|---|---|
Control Groups | 27 | 50 | 15 | 92 |
Experimental Groups | 8 | 24 | 30 | 62 |
Total | 35 | 74 | 45 | 154 |
Levels of Progress | 0 or less (%) | 1(%) | 2 or more (%) |
|---|---|---|---|
Control Group | 29 | 54 | 17 |
Experimental Group | 13 | 39 | 48 |
We observed a statistically significant association between the sending home of a parental letter and levels of progress made in Unit 2: χ2 (df 2, n=154) = 19.34, p<.05 (Tables 3 and 4). [The presentation of the test statistic follows this pattern: χ² (df1, n=919) = 34.5, p<0.05. χ² refers to the chi-square test, df is the degrees of freedom, n is the number in the sample, the number is the test statistic and the p-value is the confidence level (95%).]
Unit 4 where letter was sent home
Levels of Progress | 0 or less | 1 | 2 or more | Total |
|---|---|---|---|---|
Control Group | 30 | 64 | 16 | 110 |
Experimental Group | 8 | 30 | 14 | 52 |
Total | 38 | 94 | 30 | 162 |
Levels of Progress | 0 or less (%) | 1 (%) | 2 or more (%) |
|---|---|---|---|
Control Group | 27 | 58 | 15 |
Experimental Group | 15 | 58 | 27 |
We observed a statistically significant association between the sending home of a parental letter and levels of progress made in Unit 4: χ2 (df 2, n=162) = 5.05, p<.05 (Tables 5 and 6).
Unit 3 where no letter was sent home
[1] The presentation of the test statistic follows this pattern: χ² (df1, n=919) = 34.5, p<0.05. χ² refers to the chi-square test, df is the degrees of freedom, n is the number in the sample, the number is the test statistic and the p-value is the confidence level (95%).
Levels of Progress | 0 or less | 1 | 2 or more | Total |
|---|---|---|---|---|
Students in the top and bottom sets | 24 | 69 | 20 | 113 |
Students in the middle sets | 12 | 30 | 18 | 60 |
Total | 36 | 99 | 38 | 173 |
Levels of Progress | 0 or less (%) | 1 (%) | 2 or more (%) |
|---|---|---|---|
Students in the top and bottom sets | 21 | 61 | 18 |
Students in the middle sets | 20 | 50 | 30 |
We observed no statistically significant difference between the students in the control group and the students in the experiment group in terms of the progress in Unit 3 (where no letter was sent home).
Conclusions and implications for practice
Supplying students with targets to improve is far from a new idea, nor is the idea that younger students can work independently. The data collected supports the hypotheses that increasing parental awareness aids the progress of year 7 students, reducing assessable elements and providing targets increases progress students make, and removing levels on formative assessment reduces students’ test anxiety.
It is crucial that secondary teachers do not expect Year 7 students to arrive in September, ready to function independently. We must consider the amount of support and communication provided to the students and the parents in a primary school setting, and slowly remove or adapt what is being offered. As the capacity to work independently is so useful for students preparing for GCSE examinations it would be important to consider how teachers are supporting students in each year to gradually build their ability to work independently.
In order to foster independent learning in Year 7 students the following conditions need to be met.
- Parents need to be made aware of which topics or skills their child needs to improve upon.
- Resources need to be provided which are easy to use, explain key concepts well and provide opportunities to practice.
- Students need to be given ample opportunity to see evidence that they have made progress.
These three conditions have guided the development of further schemes of work. Furthermore, it is through improving the clarity of assessment that students’ progress and confidence are improved.
Unfortunately, it is not economically or logistically viable to send a parent letter home to all students, after every pre-unit test, for every subject. Electronic versions of this letter were explored. However, due to issues with the time taken to produce a personalised email and the volume of information sent home in this format, it was concluded that electronic mail was also not viable. So in order to maintain detailed communication between teachers and parents further strategies are being trialled. Nurturing students’ ability to learn independently and promoting an intrinsic love of a subject is the ultimate goal of any educator. The data collected in this project strongly support the conclusion that using pre- and post- testing, maintaining detailed communication with parents, and using investigations to support depth of understanding, can help to foster independence and an appreciation of mathematics.
References
- Boaler, J. (2015) The elephant in the classroom: Helping children learn and Love Maths. United Kingdom: Souvenir Press.
- DfE (2015) Final Report of the Commission on Assessment without Levels, DfE. Available at: https://www.gov.uk/government/uploads/system/uploads/attachment_data/file/483058/Commission_on_Assessment_Without_Levels_-_report.pdf
- Diamond, I. and Jeffries, J. (2001) Beginning Statistics – an introduction for social scientists. London: Sage
- Dweck, C.S. (2006) Mindset: The new psychology of success. New York: Random House Publishing Group.
- Education Endowment Foundation (2016). The evidence for marking, Best Evidence in Brief. Available online at: http://ieeyork.blogspot.co.uk/search/label/marking
- Gibb, N. (2015) Assessment after levels, parliamentary speech, DfE, available online at: https://www.gov.uk/government/speeches/assessment-after-levels
- Slavin, R. E. (1990) ’Achievement effects of ability grouping in secondary schools: a best evidence synthesis.’ Review of Educational Research, 60, pp.471-490.
- Williams, D. (2011) Embedded formative assessment. Bloomington. IN: Solution Tree Press.
LINK 2017, vol. 3, issue 1 / Copyright 2017 University of Hertfordshire