Simulating the Milky Way
(Kobayashi)
Chemical Enrichment
Different elements are produced from different types of supernovae with different timescales, with the consequence that elemental abundance ratios evolve inside a galaxy. Using chemical evolution models, the time evolution of elements have been well reproduced in the solar neighbourhood with metal-dependent nucleosynthesis yields of 1) core-collapse supernovae for massive stars (Kobayashi et al. 2006), 2) thermonuclear supernovae from low-mass binary stars with the metallicity effect (Kobayashi et al. 1998), and low-mass AGB stars (Kobayashi et al. 2011).
Evolution of elemental abundances relative to iron [X/Fe] against [Fe/H] in the solar neighbourhood. The dots are for observations of stars taken from various literatures, and the lines are for our one-zone chemical evolution model.
High-resolution multi-object spectrographs such as GAIA-ESO survey, APOGEE, HERMES, WEAVE, in which we are participating, will deliver elemental abundances for million of stars in the Local Group. In order to understand the origin of the scatter, we need a realistic model.
Chemodynamical simulations
We study the formation and evolutionary histories of Milky Way-type galaxies using the chemo-dynamical simulations described by Kobayashi & Nakasato (2011). These incorporate Smoothed Particle Hydrodynamics (SPH) to describe hydrodynamics, and direct summation with the GRAPE system or tree method describes gravity. The relevant physical processes such as radiative cooling, star formation, supernovae feedback, and chemical enrichment are all included. This enables these simulations to be compared with observed elemental abundances of stars in various locations - bulge, disk, halo, and satellite galaxies. In the simulations, the bulge have formed by assembly of gas-rich subgalaxies. The disk forms inside-out with a longer timescale. A half of the thick disk stars come from the minor merging of satellite galaxies.

B-band Luminosity Map of our simulated Milky Way-type galaxy at present for the face-on (left panel) and edge-on (right panel) projections. Each panel is 20 kpc on a side.
Galactic Archaeology
Using our simulations, we have predicted the time/redshift evolution of the spatial distribution of elements from Lithium to Zinc (A=30). This will be extended up to Uranium (A=92) using new AGB yields and r-process calculations (Kobayashi et al. 2015). By comparing with observations, we aim to untangle the star formation and chemical enrichment histories of the Milky Way Galaxy.
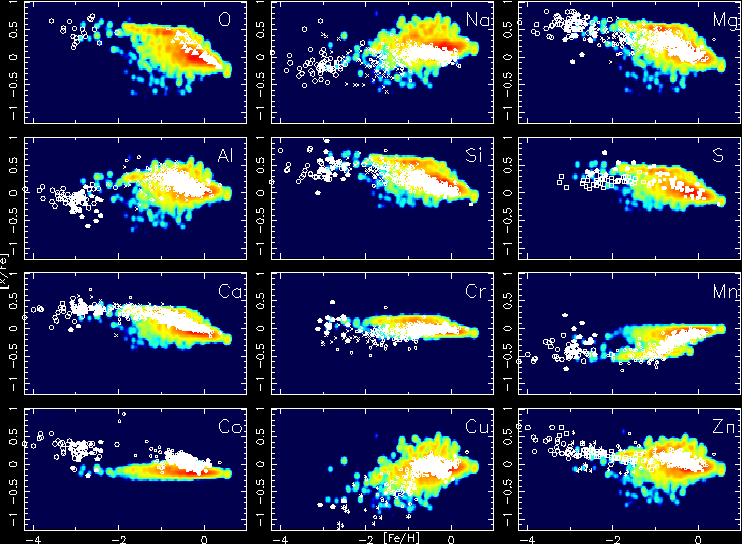
[X/Fe]-[Fe/H] relations in the solar neighbourhood at z=0. The contours show the frequency distribution of stars in the simulated galaxies, where red is for the highest frequency. The white dots are for observations taken from various published studies.
This quest is fundamentally tied to the mystery of the origin of the elements, which has a clear connection with the origins of life. Our human body comes 90% from stellar dust. But what kind of stars were they? How did they explode?