Software Development in the Framework of the Aerosol-Cloud-Ecosystems Mission (ACE) in Cooperation With NASA Langley Research Center (LaRC)
Langley Research Center developed the world's first airborne 3 backscatter + 2 extinction multiwavelength High Spectral Resolution Lidar (HSRL-2). The system has been participating in several field missions since mid 2012 when the instrument became operational. Our team develops data inversion algorithms for the analysis of data acquired with this system. Some additional information on this project and the instrument can be found in Müller et al. [2014].
Briefly, HSRL-2 operates at laser wavelengths of 355, 532, and 1064 nm. HSRL-2 measures profiles of particle backscatter coefficients and linear particle depolarization ratios at 355, 532, and 1064 nm, and particle volume extinction coefficients at 355 and 532 nm. The extinction and backscatter coefficients at 355 and 532 nm are derived using the HSRL technique [Grund and Eloranta, 1991]. The backscatter coefficient at 1064 nm is measured using the standard backscatter technique [Fernald, 1984], but with the benefit of transfer of calibration using the 532 nm HSRL retrievals in clear-air regions of the profile [Hair et al., 2008].
Our software development aims at carrying out unsupervised, automated retrievals of microphysical parameters of particulate air pollution (mean particle size, number, surface-area, and volume concentration, real and imaginary part of the complex refractive index) with inversion algorithms that use the optical data from HSRL-2 as input information. On the basis of the information on the derived microphysical properties we can compute single-scattering albedo (= scattering-to-extinction ratio) and light-absorption coefficients. Light-absorption by aerosol particles poses one of the biggest challenges in accurately assessing climate change by man-made pollution. ACE addresses the investigation of particle light-absorption as one of the key goals. The airborne lidar serves as simulator for a potential space-borne instrument that would be launched as part of the ACE mission.
The following figure shows an example of data analysis carried out with our software. Details can be found in Müller et al. [2014]. The figure shows curtain plots for a 5-min flight segment during which the aircraft lidar took data of a pollution plume that consisted of urban haze and smoke transported from the northeast of the US and Canada out over the North Atlantic Ocean. We averaged the individual optical lidar profiles in this 5-min time segment, and we split the profiles into height layers of 150 m geometrical depth. In that way we obtained 20 sets of optical data that were processed with our automated, unsupervised algorithm. We then produced the profiles of the microphysical particle parameters. We see that effective radius does not significantly vary with height. It is approximately 0.2 μm which is characteristic for urban aerosols and/or smoke. The inversion results agree within the error bars with in situ measurements that were carried out aboard another aircraft that flew nearby the aircraft that carried the lidar. The sampling volume of the in situ probe is significantly smaller than the sampling volume of the lidar. Small-scale variations in particle effective radius cannot be resolved with our inversion methodology. Number, surface-area and volume concentration obtained from data inversion and in situ measurements are close to each other, too.
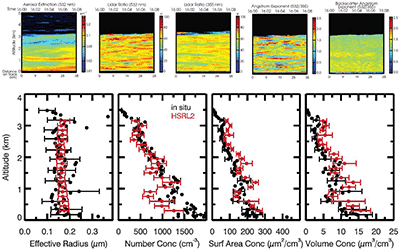
The figure above shows curtain plots of a 5-min flight segment that was used for the data inversion. (Bottom) Microphysical parameters retrieved from the inversion method (red) and from the G-1 aircraft aboard which the in situ measurements were made (black) on 17 July 2012. The measurement time was 16:00–16:05 UTC for the inversion results and 15:45–15:56 UTC for the in situ data. The lidar measurements were obtained 2 km away from the approximate center of the spiral that was flown by the G-1 aircraft during the time of the lidar measurements. The inversion results represent height intervals of 150 m. The in situ data were taken with considerably higher spatial resolution. Error bars of the individual in situ data points are composed of two types, counting and sizing. The error bars denote 1 standard deviation.
Literature
- Fernald, F. G., Analysis of atmospheric lidar observations: Some comments, Appl. Opt., 23, 652–653, 1984.
- Grund, C. J. and Eloranta, E.W.: The University of Wisconsin High Spectral Resolution Lidar, Opt. Eng., 30, 6–12, 1991.
- Hair, J. W., Hostetler, C. A., Cook, A. L., Harper, D. B., Ferrare, R. A., Mack, T. L.,Welch,W., Izquierdo, L. R., and Hovis, F. E., Airborne high-spectral-resolution lidar for profiling aerosol optical profiles, Appl. Opt., 47, 6734–6752, 2008.
- Müller, D., C. A. Hostetler, R. A. Ferrare, S. P. Burton, E. Chemyakin, A. Kolgotin, J. W. Hair, A. L. Cook, D. B. Harper, R. R. Rogers, R. W. Hare, C. S. Cleckner, M. D. Obland, L. Berg, D. Chand, J. Tomlinson and B. Schmidt, Airborne multiwavelength High-Spectral-Resolution Lidar (HSRL-2) observations during TCAP 2012: Vertical profiles of optical and microphysical properties of a fresh smoke/urban haze plume over the Eastern US, Atmos. Meas. Techn. 7, 3487 – 2396, doi:10.5194/amt-7-3487-2014, 2014.