Lidar Spectroscopy Instrument (LiSsI)
The setup of a completely new instrument is currently being designed in our lab. Simulations with ZEMAXTM give us important information such as what strengths we can expect from our Raman scattering and fluorescence signals at various excitation wavelengths. The software allows investigating the correct positioning of the lasers, the optics, and detectors in order to maximize the signal strengths required to turn the laser spectroscopy instrument into a lidar instrument. Among the various parameters critical to a lidar is the temporal resolution of the measurements. This property determines the vertical resolution of the profiles of atmospheric pollution we are interested in as well as the integration time required for analysing the measurements.
A sketch of the LiSsI facility is presented below. The main components are one high power Nd:YAG laser (green), one optical parametric oscillator (OPO) (light green), beam expanders (blue), aerosol chambers for gases, liquids, and particles (grey), an array of spectrometers (yellow), the signal detection unit (red), a telescope for near and far range signal detection in the atmosphere (yellow), and a Raman microscope (black). The arrows indicate possible paths of the laser-light beams and the signals, which depends on the exact configuration of the final system design. Dots indicate optical elements that are used to direct the signals to the spectrometers and the detector unit.

This laser facility will complement our expertise with regard to measurements of optical properties of aerosol pollution on the basis of Raman scattering. We also have 20 years of expertise in the development of inversion algorithms, and recently we started work on data mining and artificial neural networks (ANN). These tools are used for deriving microphysical properties of particulate pollution, i.e., mean particle size, number, surface-area, and volume concentration from measurements with multi-wavelength Raman lidar and multi-wavelength HSRL (High-Spectral Resolution Lidar) and the combination of multiwavelength lidar with passive remote sensors such as sun photometers. In that regard AERONET sun photometers are our prime source of optical data. We operate one of these instruments at our Bayfordbury observatory which is located north of Hatfield.
Proof of concept of LiSsI project
The lidar facility will be developed on the basis of experience we gain with our MRS.LEA lidar instrument that is operated in South Korea. This lidar has been used since 2010 to measure one main component of mineral dust, i.e. silicon dioxide in mineral dust. Silicon dioxide is the most abundant chemical component of mineral dust; roughly 30% – 75% of East Asian dust consists of silicon dioxide (mineral quartz). Our lidar in South Korea until now has provided us with a wealth of data on East Asian dust plumes. The following section provides a few more details of the work we are carrying out in Korea on the basis of two measurement examples.
Quartz Measurements (Silicon Dioxide) in East Asian Mixed Pollution Plumes
We developed a novel measurement channel that utilises signals of Raman scattering from silicon dioxide (SiO2) quartz at ultraviolet wavelengths. The quartz is excited with the primary wavelength of 355 nm which subsequently leads to the emission of photons at 361 nm. In combination with Raman signals from scattering from nitrogen molecules we infer the mineral-quartz-related backscatter coefficient. This technique thus allows us to identify in a comparably direct way the mineral quartz content in mixed pollution plumes that consist, e.g., of a mix of desert dust and urban pollution. The technique is built upon experience gained in previous work [Tatarov et al., 2005] in which the excitation wavelength at 532 nm was used.
Methodology
The basic idea of the methodology is to use quartz as a tracer for detecting mineral dust. For this purpose we measure signals from Raman scattering from quartz grains [Müller et al., 2010; Tatarov et al., 2011]. The Raman backscatter coefficient βR(r,λL,λR) of the scatterers can be determined from the received Raman scattering signals. The mass concentration of silica in the atmosphere can be estimated from the Raman backscatter coefficient of quartz. We use the relationship that connects the Raman backscatter coefficient with the Raman backscatter differential cross section dσ(λL,λR,π)/dΩ and the number density of quartz molecules Nq. This relation is defined as:
Using this equation, we can estimate the number density Nq if the differential cross-section is known. We obtain the mass concentration of mineral quartz by multiplying Nq with the molecular mass of silicon dioxide.
Instrument setup of MRS.LEA for Raman Quartz Measurements
The picture above shows the setup of MRS.LEA when it is used for Raman scattering measurements of silicon dioxide. Raman signals at 361 nm (primary emission wavelength is 355 nm) and at 546 nm (primary emission wavelength is 532 nm) are measured. Beamsplitters are used to separate the various signals. Interference filters in front of photomultiplier tubes are then used to measure the backscattered photons at the desired wavelengths.
Measurement Example: March 2010 – First Observations With MRS.LEA
The following example shows the first observations of a mixed dust/industrial pollution plume carried out with the optimised set-up of our Raman silicon-dioxide Raman channels [Müller et al., 2010; Tatarov et al., 2011; 2012]. The curtain plots in the figure below show the time-height distribution of a dust plume that stretches from approximately 2 - 10 km height above ground. The light blue and yellow colours in the plot denoted as "Volume Depolarisation" shows that mineral dust is present. Below 1 km height there is also some dust present. This layer is clearly separated from the lofted dust plume. The red colours indicate ice clouds (cirrus) that generate a stronger depolarisation signal than mineral dust. The upper plot of the panel shows the range-corrected backscatter signal. The colour coding shows that particles are present throughout the atmosphere to 12 km height above ground, but the signals shown in this plot do not allow us to separate mineral dust from anthropogenic pollution.

Indeed, a quantification of mineral dust and the mixing state of this dust with industrial pollution is difficult to carry out without additional knowledge of the Raman signals of silicon dioxide which can be used as direct tracer of mineral dust. A further analysis of our data reveals the profile of the pure mineral dust content of this mixed dust/pollution plume.
The figure above shows the first set of SiO2-related Raman backscatter profiles ever measured at the laser excitation wavelength of 355 nm. We also carried out for the first time simultaneous measurements of mineral quartz at 355 nm and 532 nm for quality assurance purposes. In that regard, Tatarov et al. [2005] show profiles of mineral dust measured at the excitation wavelength of 532 nm.
The figure above shows the comparison of the quartz profiles measured at 361 and 546 nm. From a theoretical point of view both profiles should be on the same as there is no physical reason why the dust concentration should depend on the measurement wavelength. Accordingly, the Ångström exponent should be 4, corresponding to molecular scattering by the silicon-dioxide molecules. We find a value close to 4 but not exactly 4. There may be various reasons for the observed deviation like measurement uncertainties, a wrong calibration of the instrument or measurements channels, misalignment of the measurement channels, etc. Details of this measurement case are described by Tatarov et al. [2011].
Strongest East Asian Dust Outbreak Over Korea of the Past 70 Years
The previous example showed the measurement situation on 21 March 2010. The day before we measured one of the strongest dust outbreaks that ever occurred in East Asia in the past decades. Details are described by Tatarov et al. [2012]. The dust plume passed over China and then spread eastward to South Korea and Japan, southeastward to Taiwan, and even reached Hong Kong. The event, which according to media reports was the strongest dust event over Korea in the past 70 years provided us with a unique opportunity to test the instrument under extreme conditions.

The curtain plots of the attenuated backscatter signals and the volume depolarisation ratio in the panel above clearly show the extent of the dust plume. In-situ measurements at ground-level revealed dust concentrations (in terms of PM 2.5) of up to 1000 mg/m3 at the peak of this event. Backward trajectories confirmed that the origin of the dust plume was in Central Asia and that the dust plume had passed over Beijing causing massive impact on visibility, traffic, and human health in this heavily urbanised area.
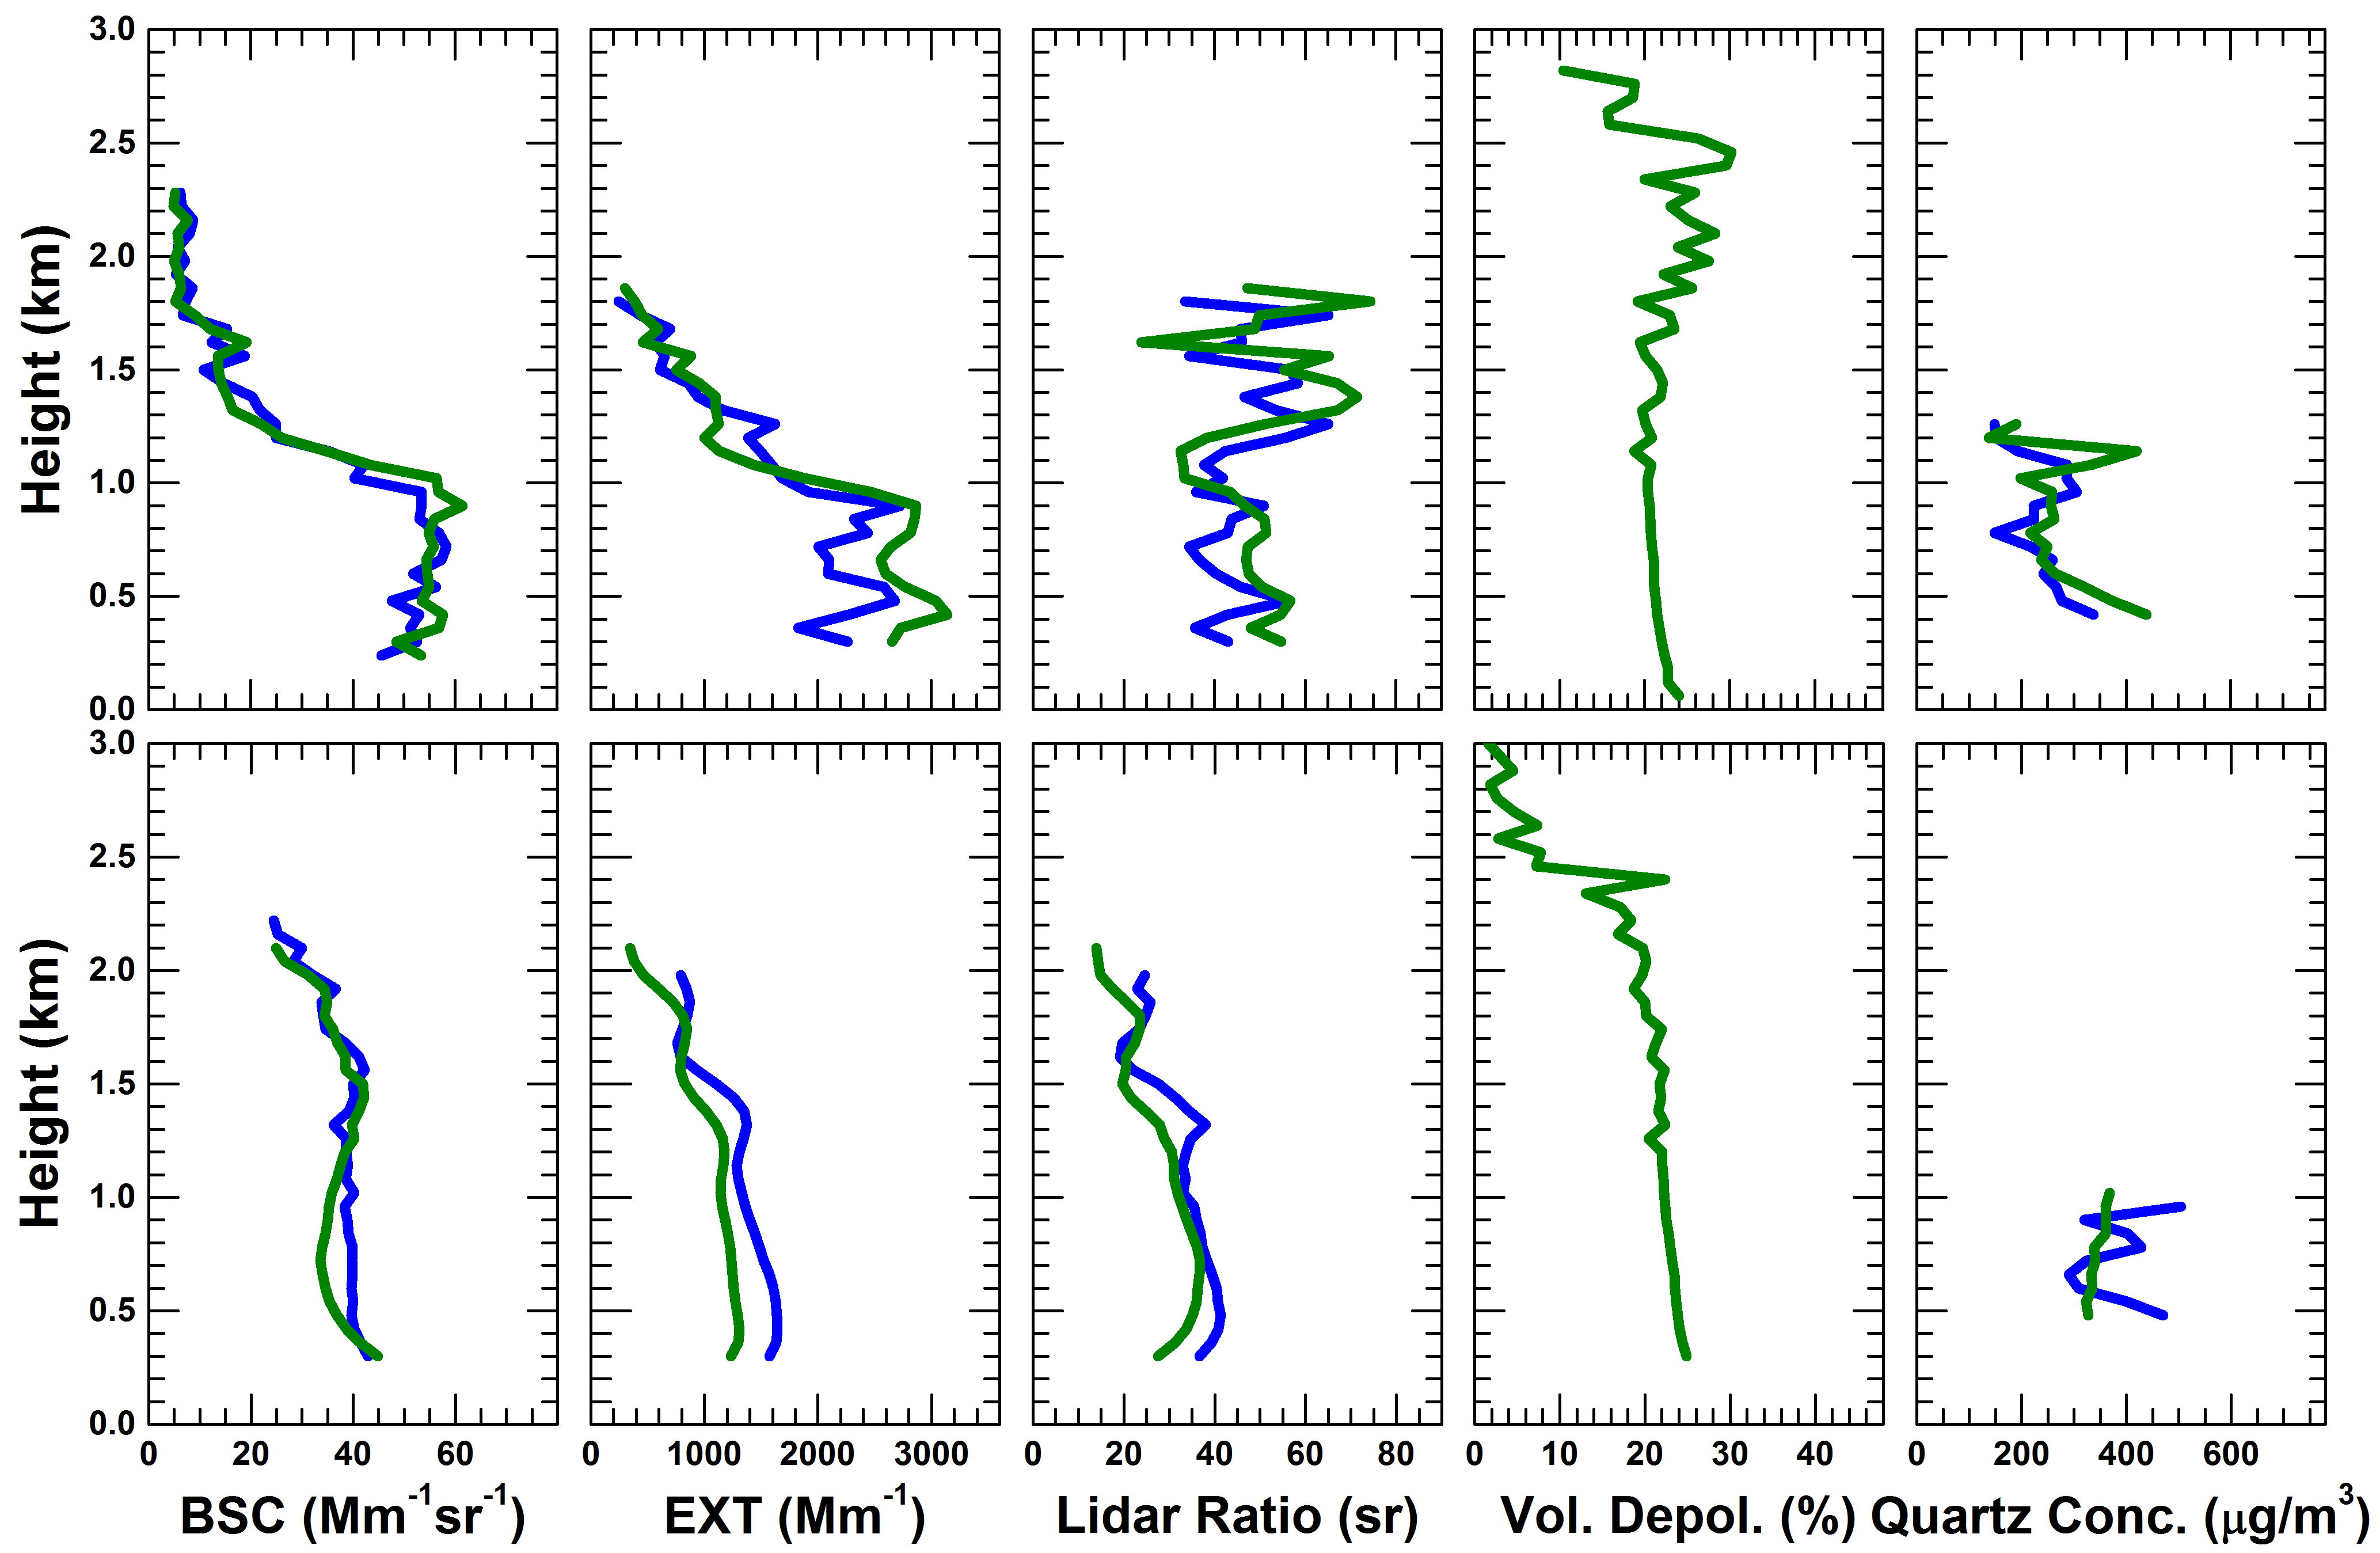
The profiles above provide a summary of the measurement capabilities of MRS.LEA in terms of available data products for dust, which includes backscatter and extinction coefficients, depolarisation ratios, lidar ratios and Ångström exponents, and profiles of backscatter coefficients from silicon dioxide. We can infer profiles of mass concentrations of silicon dioxide from lidar measurements if we assume a mixing-ratio of silicon dioxide in mineral dust, which can be inferred from literature and in-situ data and if the source region is known (e.g. from backward trajectory analysis).
Literature
- Müller, D., I. Mattis, B. Tatarov, Y. M. Noh, D. H. Shin, S. K. Shin, K. H. Lee, Y. J. Kim and N. Sugimoto, Mineral quartz concentration measurements of mixed mineral dust/urban haze pollution plumes over Korea with multiwavelength aerosol Raman-quartz lidar, Geophys. Res. Lett. 37, doi:10.1029/2010GL044633, 2010.
- Tatarov, B., and N. Sugimoto, Estimation of quartz concentration in the tropospheric mineral aerosols using combined Raman and highspectral‐resolution lidars, Opt. Lett., 30, 3407–3409, 2005.
- Tatarov, B., D. Müller, D. H. Shin, S. K. Shin, I. Mattis, P. Seifert, Y. M. Noh, Y. M. Kim and N. Sugimoto, Lidar measurements of Raman scattering at ultraviolet wavelength from mineral dust over East Asia, Opt. Expr. 19(2): 1569-1581, 2011
- Tatarov, B., D. Müller, Y.-M. Noh, K.-H. Lee, D.-H. Shin, S.-K. Shin, N. Sugimoto, P. Seifert and Y. J. Kim, Record heavy mineral dust outbreaks over Korea in 2010: Two cases observed with multiwavelength aerosol/depolarization/Raman-quartz lidar, Geophys. Res. Lett. 39, doi:10.1029/2012GL051972, 2012.